
Solargraphy
Solargraphy – Long Exposure Sun Trails Captured with Pinhole Cameras Over Weeks and Months
Fine Art Solargraphs Made with Pinhole Cameras
Long Exposure Pinhole Photography Showing Sun Trails Over Time
Archival Solargraph Prints Revealing Light and Impermanence

Eclipse over Port Maitland, 2024 –one-day solargraph of the 2024 total eclipse above Port Maitland, Ontario

Total Eclipse #2, 2024 –solargraph of sun arcs over Georgian Bay from the second 184-day set

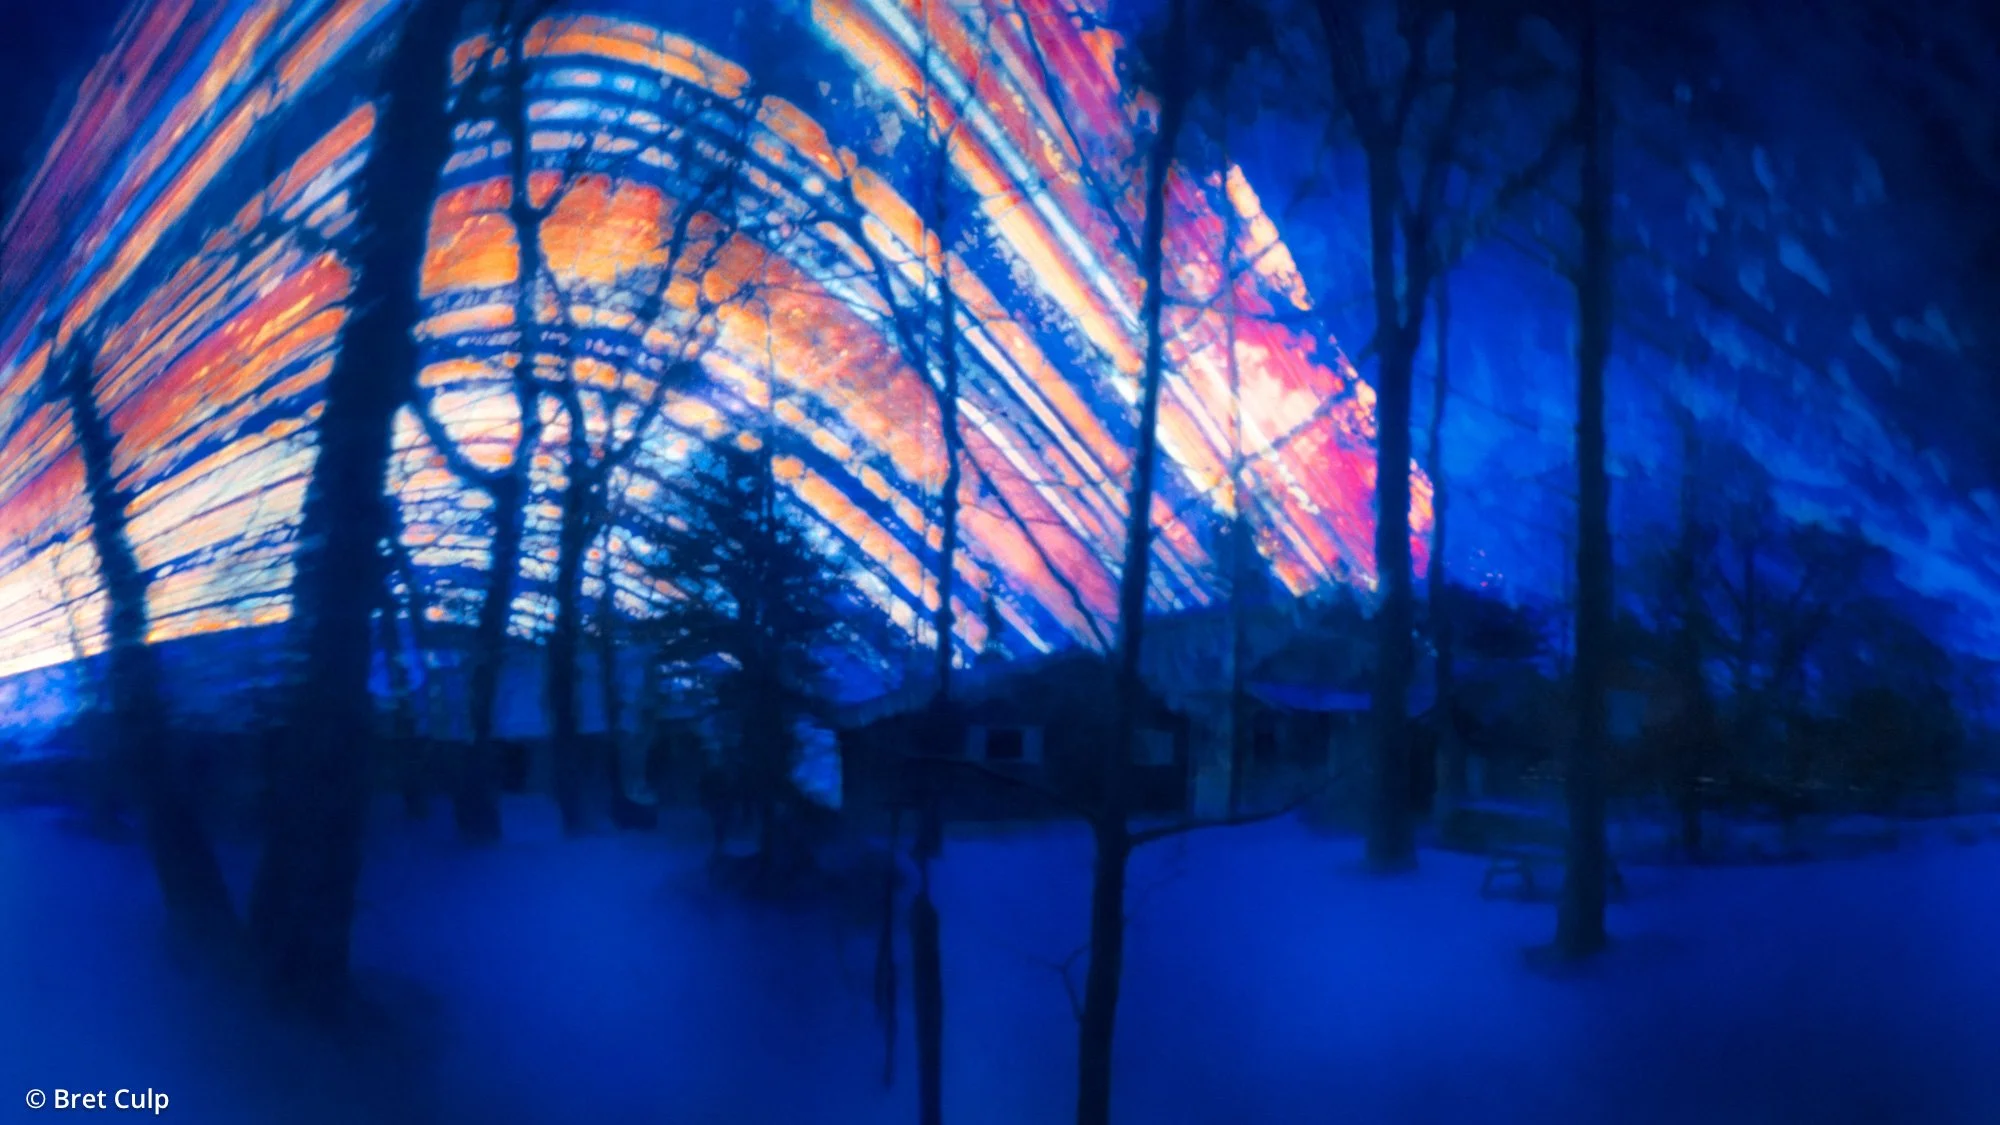
183 Sunsets Over Georgian Bay, 2023 –solargraph showing 183 evenings of sunset over Georgian Bay

183 Days, Toronto, 2023 –six-month solargraph of daily sunlight over Toronto

228 Days, Toronto, 2023 –solargraph capturing sun arcs above Toronto’s Old Eastern Avenue Bridge

183 Days, Oakville #1, 2023 –solargraph showing seasonal light above The Weather Network, Oakville (Set 1)

183 Days, Oakville #2, 2023 –long-exposure solargraph above Oakville’s Weather Network HQ (Set 2)

183 Days, Oakville #3, 2023 –solargraph from the third Oakville exposure in the 183-day series

163 Days, Vancouver, 2022 –pinhole solargraph made in Yaletown showing 163 days of sunlight

90 Days, Toronto Harbour, 2021 –solargraph tracking daylight change from winter solstice to spring equinox

169 Days, Wyebridge, 2020 –solargraph showing sun movement over Wyebridge in mid-2020

169 Days, Perkinsfield, 2020 –solargraph showing summer light over Perkinsfield, Ontario

30 Days, Elmvale Drive-Inn, 2020 –solargraph capturing short daylight arcs above Elmvale Drive-Inn

30 Days, Tiny Marsh, 2020 –solargraph of winter sun arcs over Tiny Marsh, Ontario

One Year, Georgian Bay, 2018 –365-day pinhole solargraph showing a full year of solar movement

29 Days, Georgian Bay, 2017 –solargraph showing late-summer sun movement over Georgian Bay

228 Days, Georgian Bay, 2017 –long-duration solargraph showing seasonal arcs over Georgian Bay in 2017

13 Days, Toronto, 2017 –brief winter solargraph made in Toronto near the holidays

126 Days, Toronto, 2016 –solargraph showing seasonal change in Toronto from summer to fall

113 Days, Toronto, 2016 –springtime solargraph from Toronto capturing seasonal sun arcs

162 Days, Orangeville, 2016 –solargraph showing half-year sunlight change above Orangeville

180 Days, Georgian Bay, 2016 –six-month solargraph of solar arcs over Georgian Bay

154 Days, Toronto, 2015 –long-exposure solargraph made in Toronto in 2015

184 Days #2, Georgian Bay, 2015 –solargraph of sun arcs over Georgian Bay from the second 184-day set

184 Days #1, Georgian Bay, 2015 –first 184-day exposure of the sun’s arc over Georgian Bay

127 Days, Georgian Bay, 2014 –pinhole solargraph showing early winter sunlight over Georgian Bay
Bret Culp interviewed by The Weather Network about solargraphy—capturing the sun’s path across the sky over six months using pinhole cameras.
Watch What is Solargraphy, a short video from The Weather Network’s Out of This World series — a collaboration between meteorologist and science writer Scott Sutherland and myself exploring the art and science of solargraphy.
-
The Weather Network’s “Out Of This World – Solargraphy: Capturing the Sun’s Journey in an Image.”
Music [0:00]
Scott [0:08]
From summer solstice to winter solstice in 2023, three cameras on the roof of the Weather Network each captured a six-month record of the Sun’s motion across the sky. I spoke to photographer Bret Culp about this process known as solargraphy.Bret [0:21]
Solargraphy is an alternative photography process. A normal photograph is typically exposed for a fraction of a second. Solargraphy is about capturing the movement of the Sun through the sky over days, weeks, months and longer, sometimes. This is a simple tube, as you can see, with a pinhole in it. So it’s really pinhole photography. When the light goes in, or the image comes in through the pinhole, it actually, what’s behind there is a piece of chemical light sensitive black and white photo paper. And the way the pinhole works is that the image is flipped, so the bottom [of the camera] is actually the top of what it sees out here.Scott [1:05]
Right. We’re basically creating a record, then, I guess, of over, well, for this, for six months, because we came here six months ago, on the summer solstice and set these up. So we’ve created, we’ve actually captured, captured six months worth of the Sun passing through the sky, recording clear days.Bret [1:27]
What it does capture, as you were saying, from the summer solstice, is the position where the Sun is highest in the sky, of course, and today, on the winter solstice, it’ll be the lowest. So, it captures that whole range. And the reason that it [the Sun position] changes is because the Earth has a tilt and it’s orbiting around the Sun. So there’s all of that science as well. I like to say that these things [solargraphs] are part art, part science and part chaos.Scott [1:52]
You can’t just open this up and pull out a picture. So, how would you get the actual image out of this?Bret [1:58]
Because it’s such an extreme over-exposure, you don’t develop it, otherwise it would go completely black. But you actually take it out, and it’s still light sensitive; you put it on a flatbed scanner–a computer scanner. You scan it. As you’re scanning it, you’re destroying it. So you get one shot. The resulting scan is a negative, and it’s mirrored, so you invert it, and then you flip it, and then you do a little bit of colour correction, or whatever, and typically you see these very colourful, unique images. The Chaos part of this is that sitting out there for a very extended period of time with extreme over-exposure, you end up with these very colourful images from black and white light-sensitive chemical photo paper. It’s got to do with the different kinds of photo paper, and they still make that stuff, not as much as they used to, but they still make it. The different chemical makeup of those different papers results in different casts or different colour tones as well. And then, you know, based on the temperature fluctuations during that period of time, whether it freezes, how humid it is during that time. If mould or bugs even, can get into the camera, water, whatever. It’s all part of it; it all adds to the surprise. And it’s all part of the fun. I love the surprise of this. It kind of gone in photography, right? That idea of we don’t know we’re going to get till we take it home and develop. Well, that’s what you get with this. And as you were saying, in that six-month period of time, you also get a chance to see six months of weather because where there isn’t a track, it was a cloudy day, similar to what it is today. And clearly where there’s a track, a sun track, it was a sunny day. And then you have the mixed day. So you have a record of six months of weather in this thing, making these things completely one-of-a-kind unique as well. 50% art, 50% science, 50% chaos.Scott [4:06]
[Laughter]
Very cool. Thanks, Bret.Bret [4:09]
Thank you.
Part Art – Part Science – Part Chaos
Solargraphy is an alternative photographic process that captures the sun’s path across the sky over days, weeks, and months using a custom-built pinhole camera and light-sensitive black and white photo paper. Each exposure records the sun’s rising and falling arc, gradually shifting with the seasons due to the Earth’s axial tilt and elliptical orbit. The result is a single visual record of time and celestial motion that we cannot otherwise see.
These vivid impressions are shaped by both natural forces and chemical unpredictability. Colour shifts emerge from extreme overexposure, moisture, temperature fluctuations, and even organic intrusion — mould, insects, or water. The chemical makeup of each brand of photo paper introduces further variation, making every solargraph a one-of-a-kind collaboration between light, material, and time.
Unlike conventional analog photographs, solargraphs are not developed in the darkroom. The extreme exposure burns the image directly into the paper, which remains sensitive to light. A high-resolution flatbed scan is made to extract the image, but the scanner’s light gradually destroys it in the process. You only get one chance. The resulting “negative” is then inverted, flipped, and processed to reveal ghostly sun trails, shifting skies, and traces of countless days. Each image holds within it everything that happened under the sun.
Read Scott Sutherland’s article, Solargraphy: The Art, Science, and Chaos of Capturing the Sun’s Path in the Sky, published by The Weather Network. It accompanies the video above and features several of my solargraphs.

Total Eclipse over Port Maitland Lighthouse - 1 Day Solargraph (2024-04-08), Ontario, Canada

Total Eclipse #2 - 1 Day Solargraph (2024-04-08), Cornwall, Ontario, Canada /solargraphy-eclipse-2024-2

183 Sunsets Over Georgian Bay (2023.07.21 – 2023.12.21), Ontario, Canada

183 Day Solargraph (2023.07.21 – 2023.12.21), Toronto, Ontario, Canada

228 Day Solargraph (2023.05.07 – 2023.12.21), Old Eastern Avenue Bridge, Toronto, Ontario, Canada

183 Day Solargraph #1 (2023.07.21 – 2023.12.21), The Weather Network, Oakville, Ontario, Canada

183 Day Solargraph #2 (2023.07.21 – 2023.12.21), The Weather Network, Oakville, Ontario, Canada

183 Day Solargraph #3 (2023.07.21 – 2023.12.21), The Weather Network, Oakville, Ontario, Canada

163 Day Solargraph (2022.01.10 – 2022.06.21), Vancouver, British Columbia, Canada

Winter Solstice to Spring Equinox - 90 Day Solargraph (2020.12.21 – 2021.03.20), Toronto, Ontario, Canada

169 Day Solargraph (2020.07.05 – 2020.12.21), Wyebridge, Ontario, Canada

169 Day Solargraph (2020.07.05 – 2020.12.21), Perkinsfield, Ontario, Canada

30 Day Solargraph (2020.11.21 – 2020.12.21), Elmvale Drive-In, Ontario, Canada

30 Day Solargraph (2020.11.21 – 2020.12.21), Tiny Marsh, Ontario, Canada
One Year Solargraph (2017.08.07 – 2018.08.07), Georgian Bay, Ontario, Canada

29 Day Solargraph (2017.08.07 – 2017.09.05), Georgian Bay, Ontario, Canada

228 Day Solargraph (2016.12.21 – 2017.08.06), Georgian Bay, Ontario, Canada

13 Day Solargraph #2 (2016.12.22 – 2017.01.04), Toronto, Ontario, Canada

126 Day Solargraph (2016.06.24 – 2016.10.28), Toronto, Ontario, Canada, 2016

162 Day Solargraph (2016.01.09 – 2016.06.19), Orangeville, Ontario, Canada

113 Day Solargraph (2016.02.28 – 2016.06.20), Toronto. Ontario, Canada

180 Day Solargraph (2015.12.22 – 2016.06.19), Georgian Bay, Ontario, Canada

154 Day Solargraph (2015.07.20 – 2015.12.21), Toronto, Ontario, Canada

184 Day Solargraph #2 (2015.06.21 – 2015.12.22), Georgian Bay, Ontario, Canada

184 Day Solargraph #1 (2015.06.21 – 2015.12.22), Georgian Bay, Ontario, Canada

127 Day Solargraph (2014.08.16 – 2014.12.21), Georgian Bay, Ontario, Canada